TradingMay 28, 2026
QorTrade- Stock Management CRM
 Dhaval AgrawalDhaval Agrawal
Investors were juggling three apps just to check a price, read news, and place a trade. We built QorTrade to kill that friction — a single, calm platform where data, portfolio, and execution live side by side.
Investors rely on multiple apps to track markets, analyze portfolios, and trade — slowing decisions, creating confusion, and risking missed opportunities.
QorTrade brings market data, portfolio insights, and trading into one smart platform so users can move faster, stay informed, and trade with confidence. A unified platform enabling faster decisions, smarter portfolios, and seamless execution.
Investors rely on multiple apps to track markets, analyze portfolios, and trade — slowing decisions, creating confusion, and risking missed opportunities.
Solution 1: QorTrade brings market data, portfolio insights, and trading into one smart platform so users can move faster, stay informed, and trade with confidence.
Solution 2: QorTrade unifies global market data, personalised analytics, and trading tools in one intuitive platform enabling faster decisions, smarter portfolios, and seamless execution.
We ran surveys and interviews across retail investors and financial advisors. The findings pointed one direction: people didn't need more tools — they needed fewer.
Billy manages his own portfolio between meetings. He checks his phone on the commute and needs everything in one glance.
Sakura advises clients all day and can't afford a slow interface when a client is on the line. Different jobs, same bottleneck: every extra step costs real money.
Goal: Create a seamless, intuitive platform that demystifies the complexities of the stock market, making informed investment decisions accessible to everyone.
Objective: Revolutionize investment strategies by delivering unparalleled insights into diverse portfolios, market dynamics, and asset performance through intuitive data visualisations.
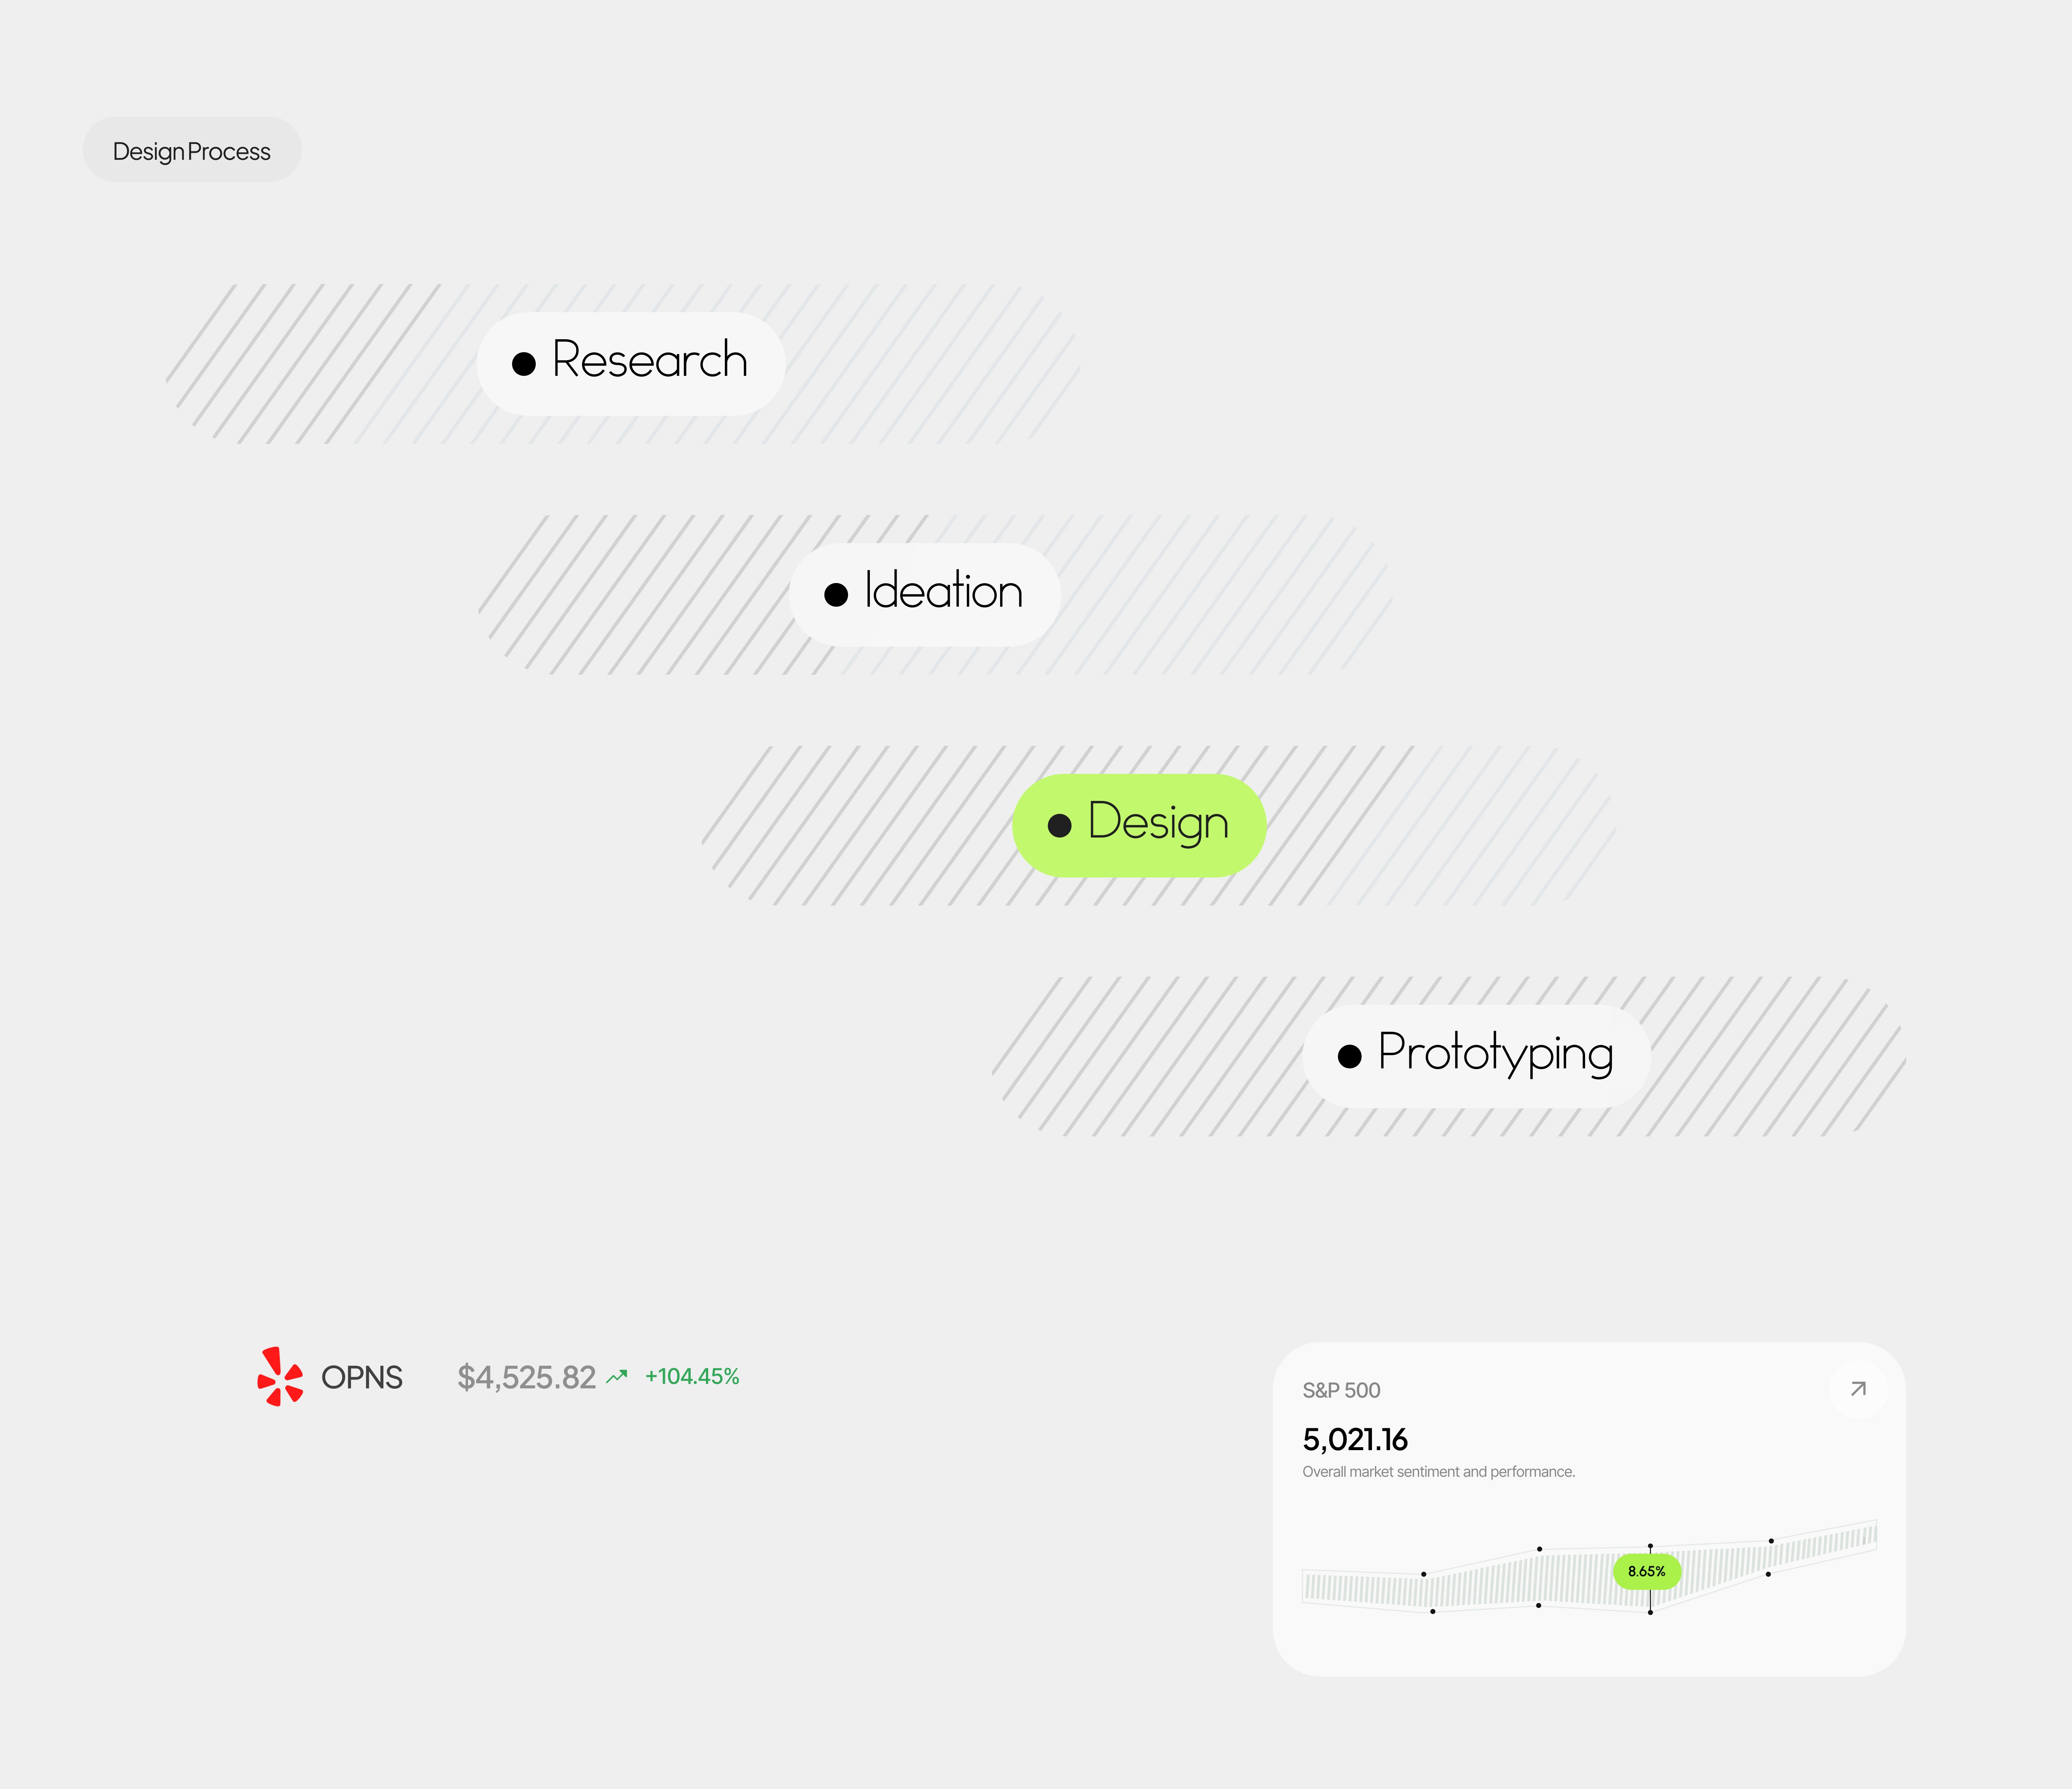
A tight four-phase sprint. Research first — assumptions cost more than interviews. Ideation stayed deliberately messy. Design is where it crystallised. Prototyping showed us what we got wrong.
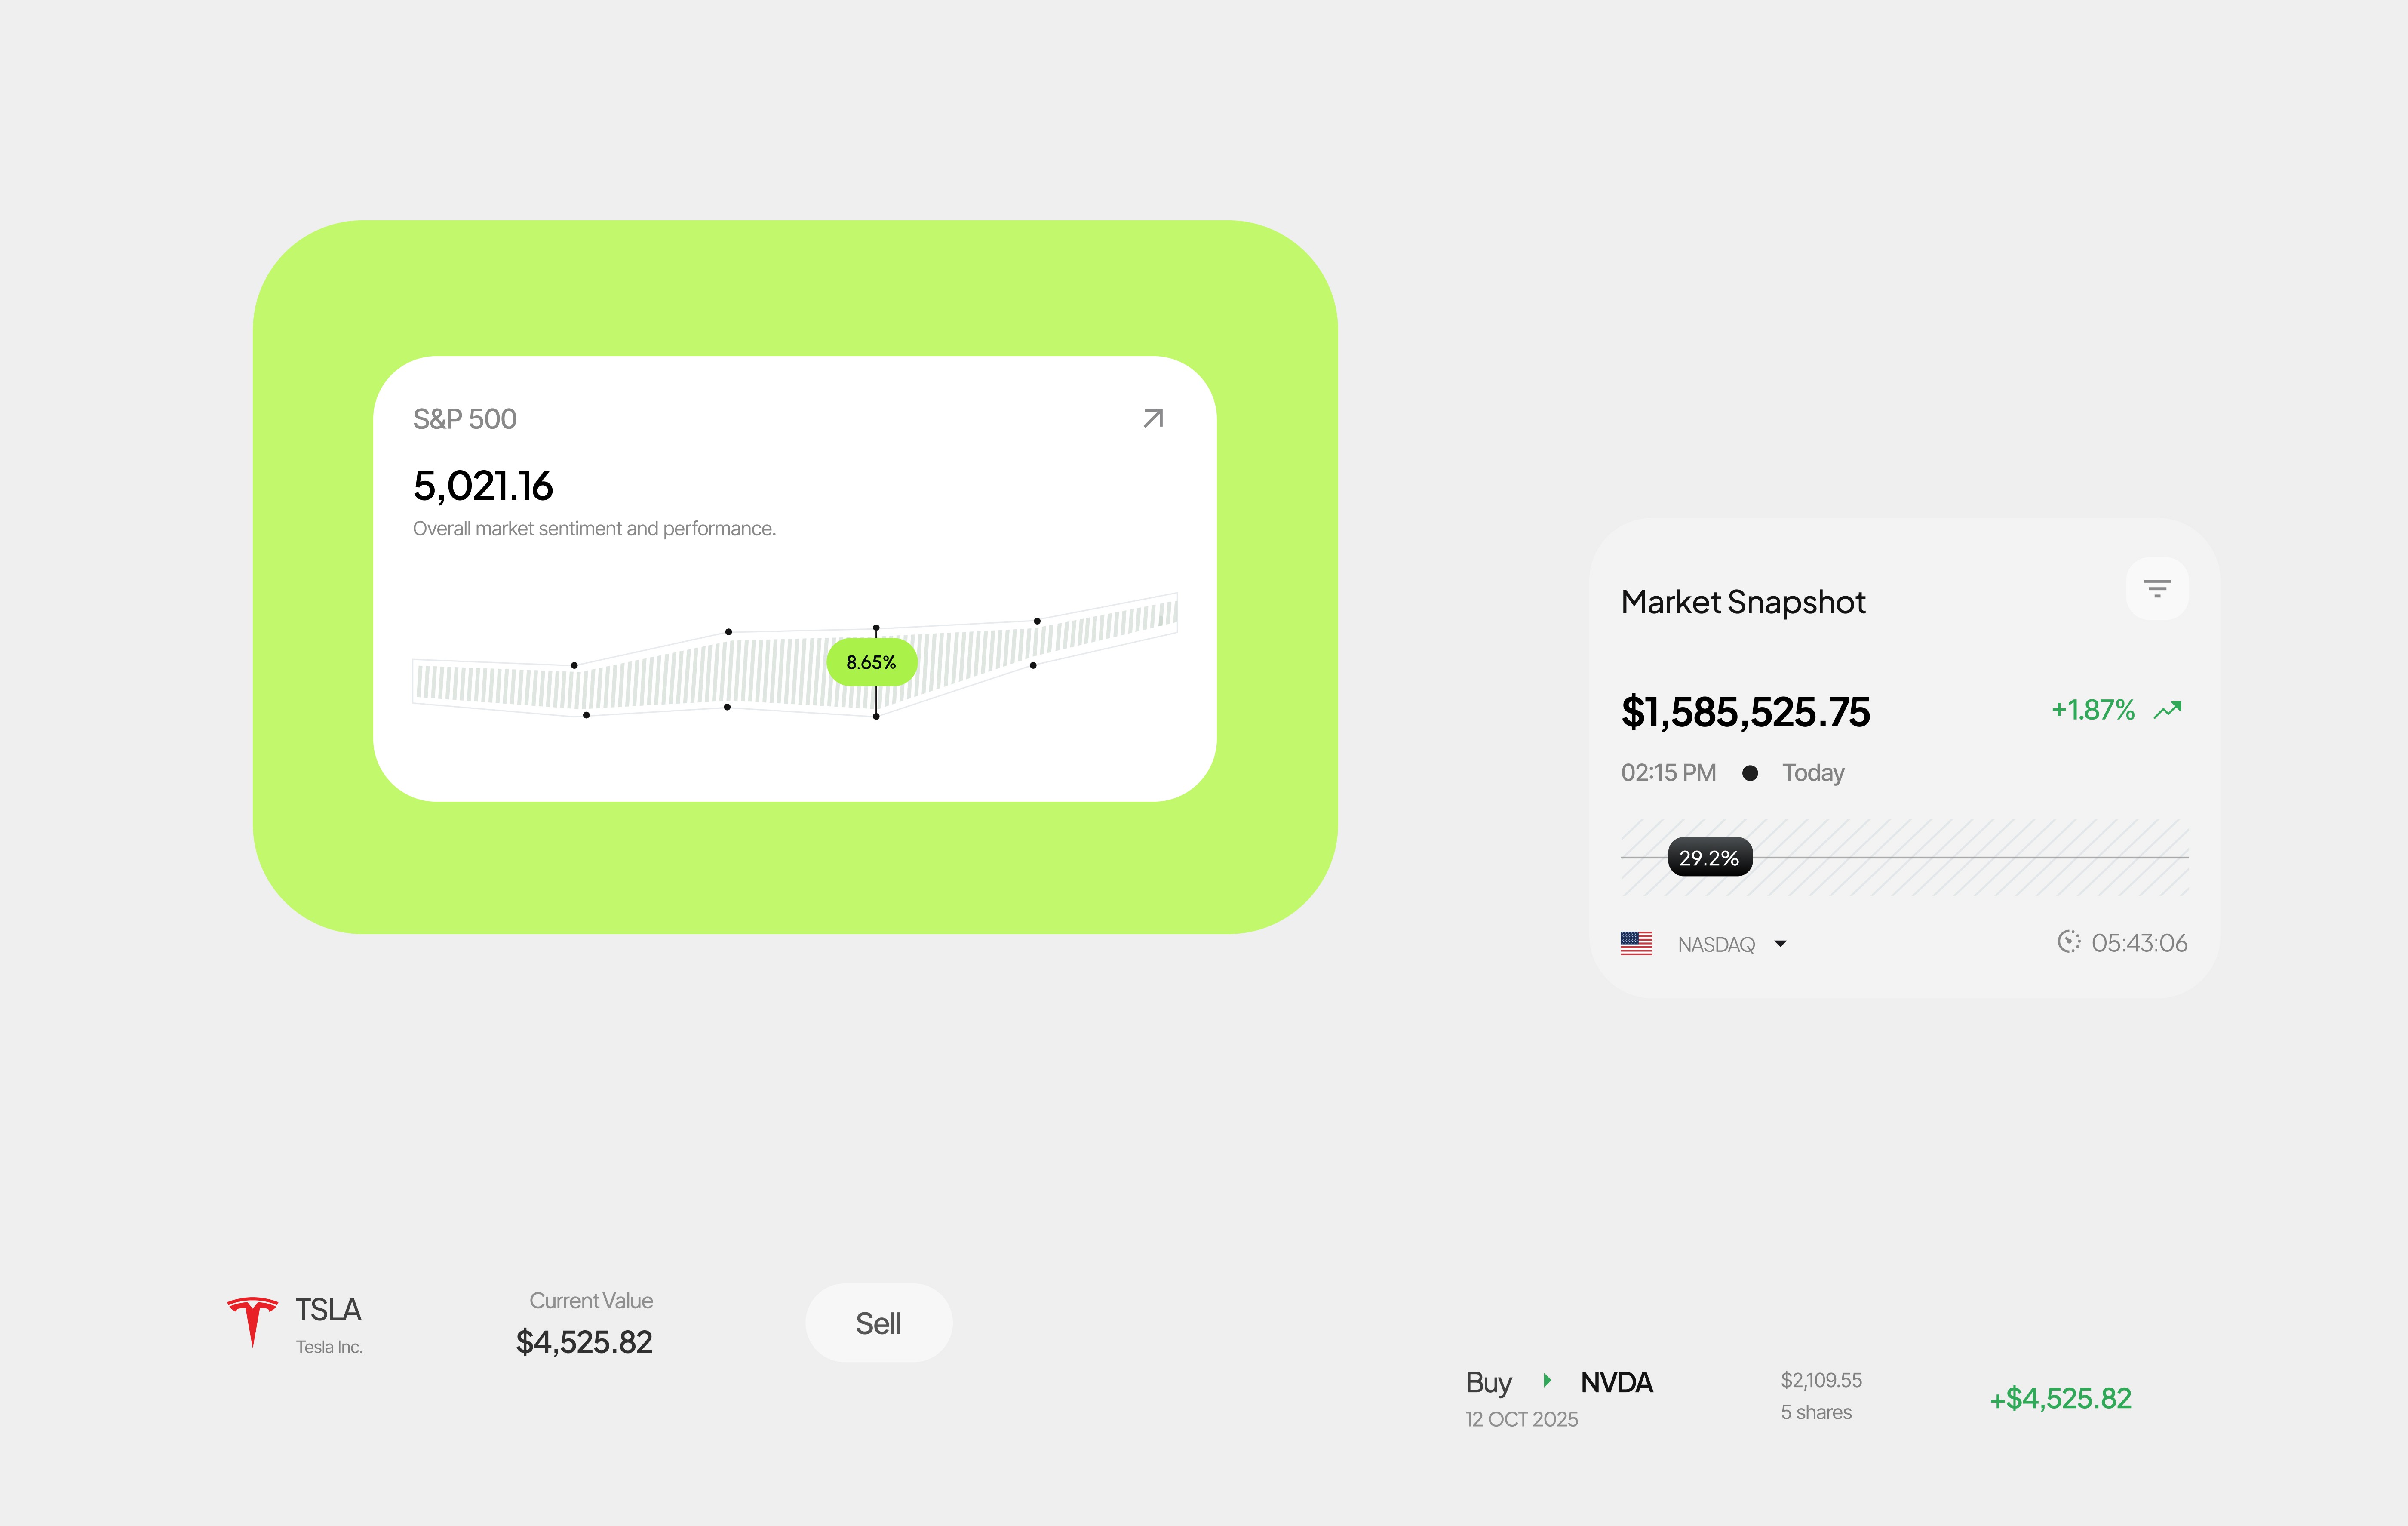
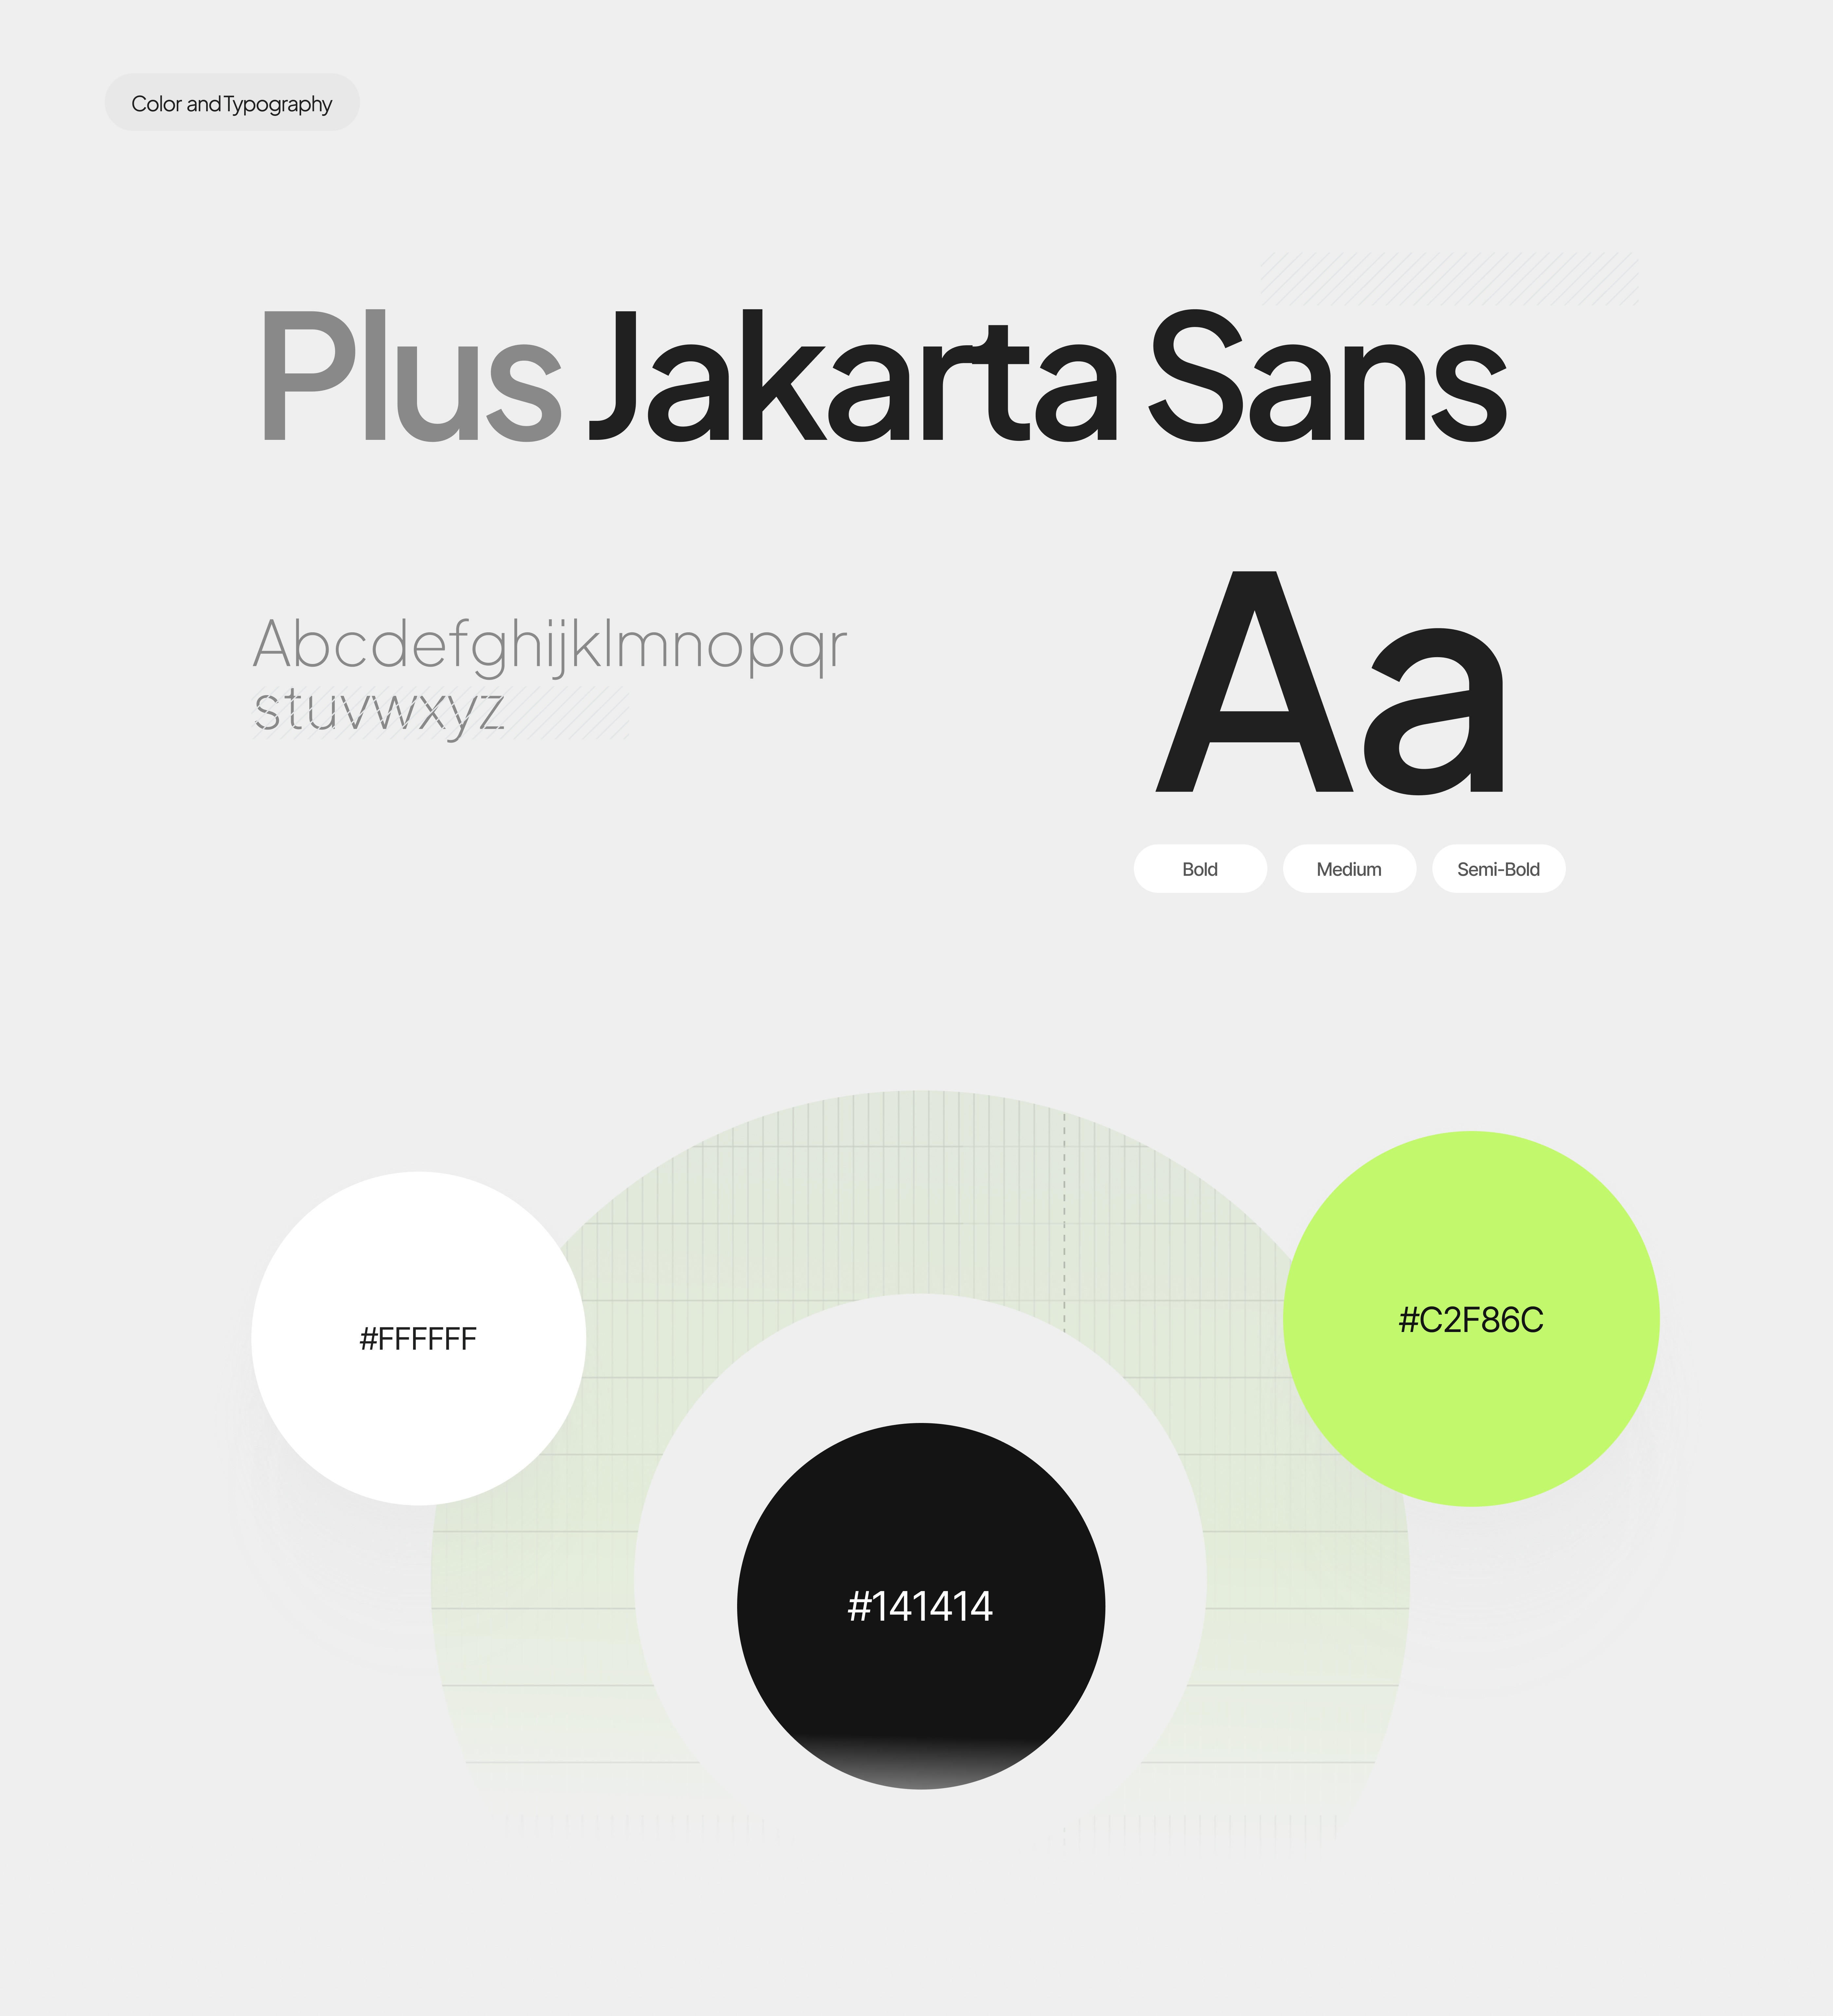
Modern without being cold. Approachable for anxious investors, sharp for seasoned analysts. Three colours: near-black #141414, pure white #FFFFFF, and one acidic green #C2F86C that signals every action and key data point.
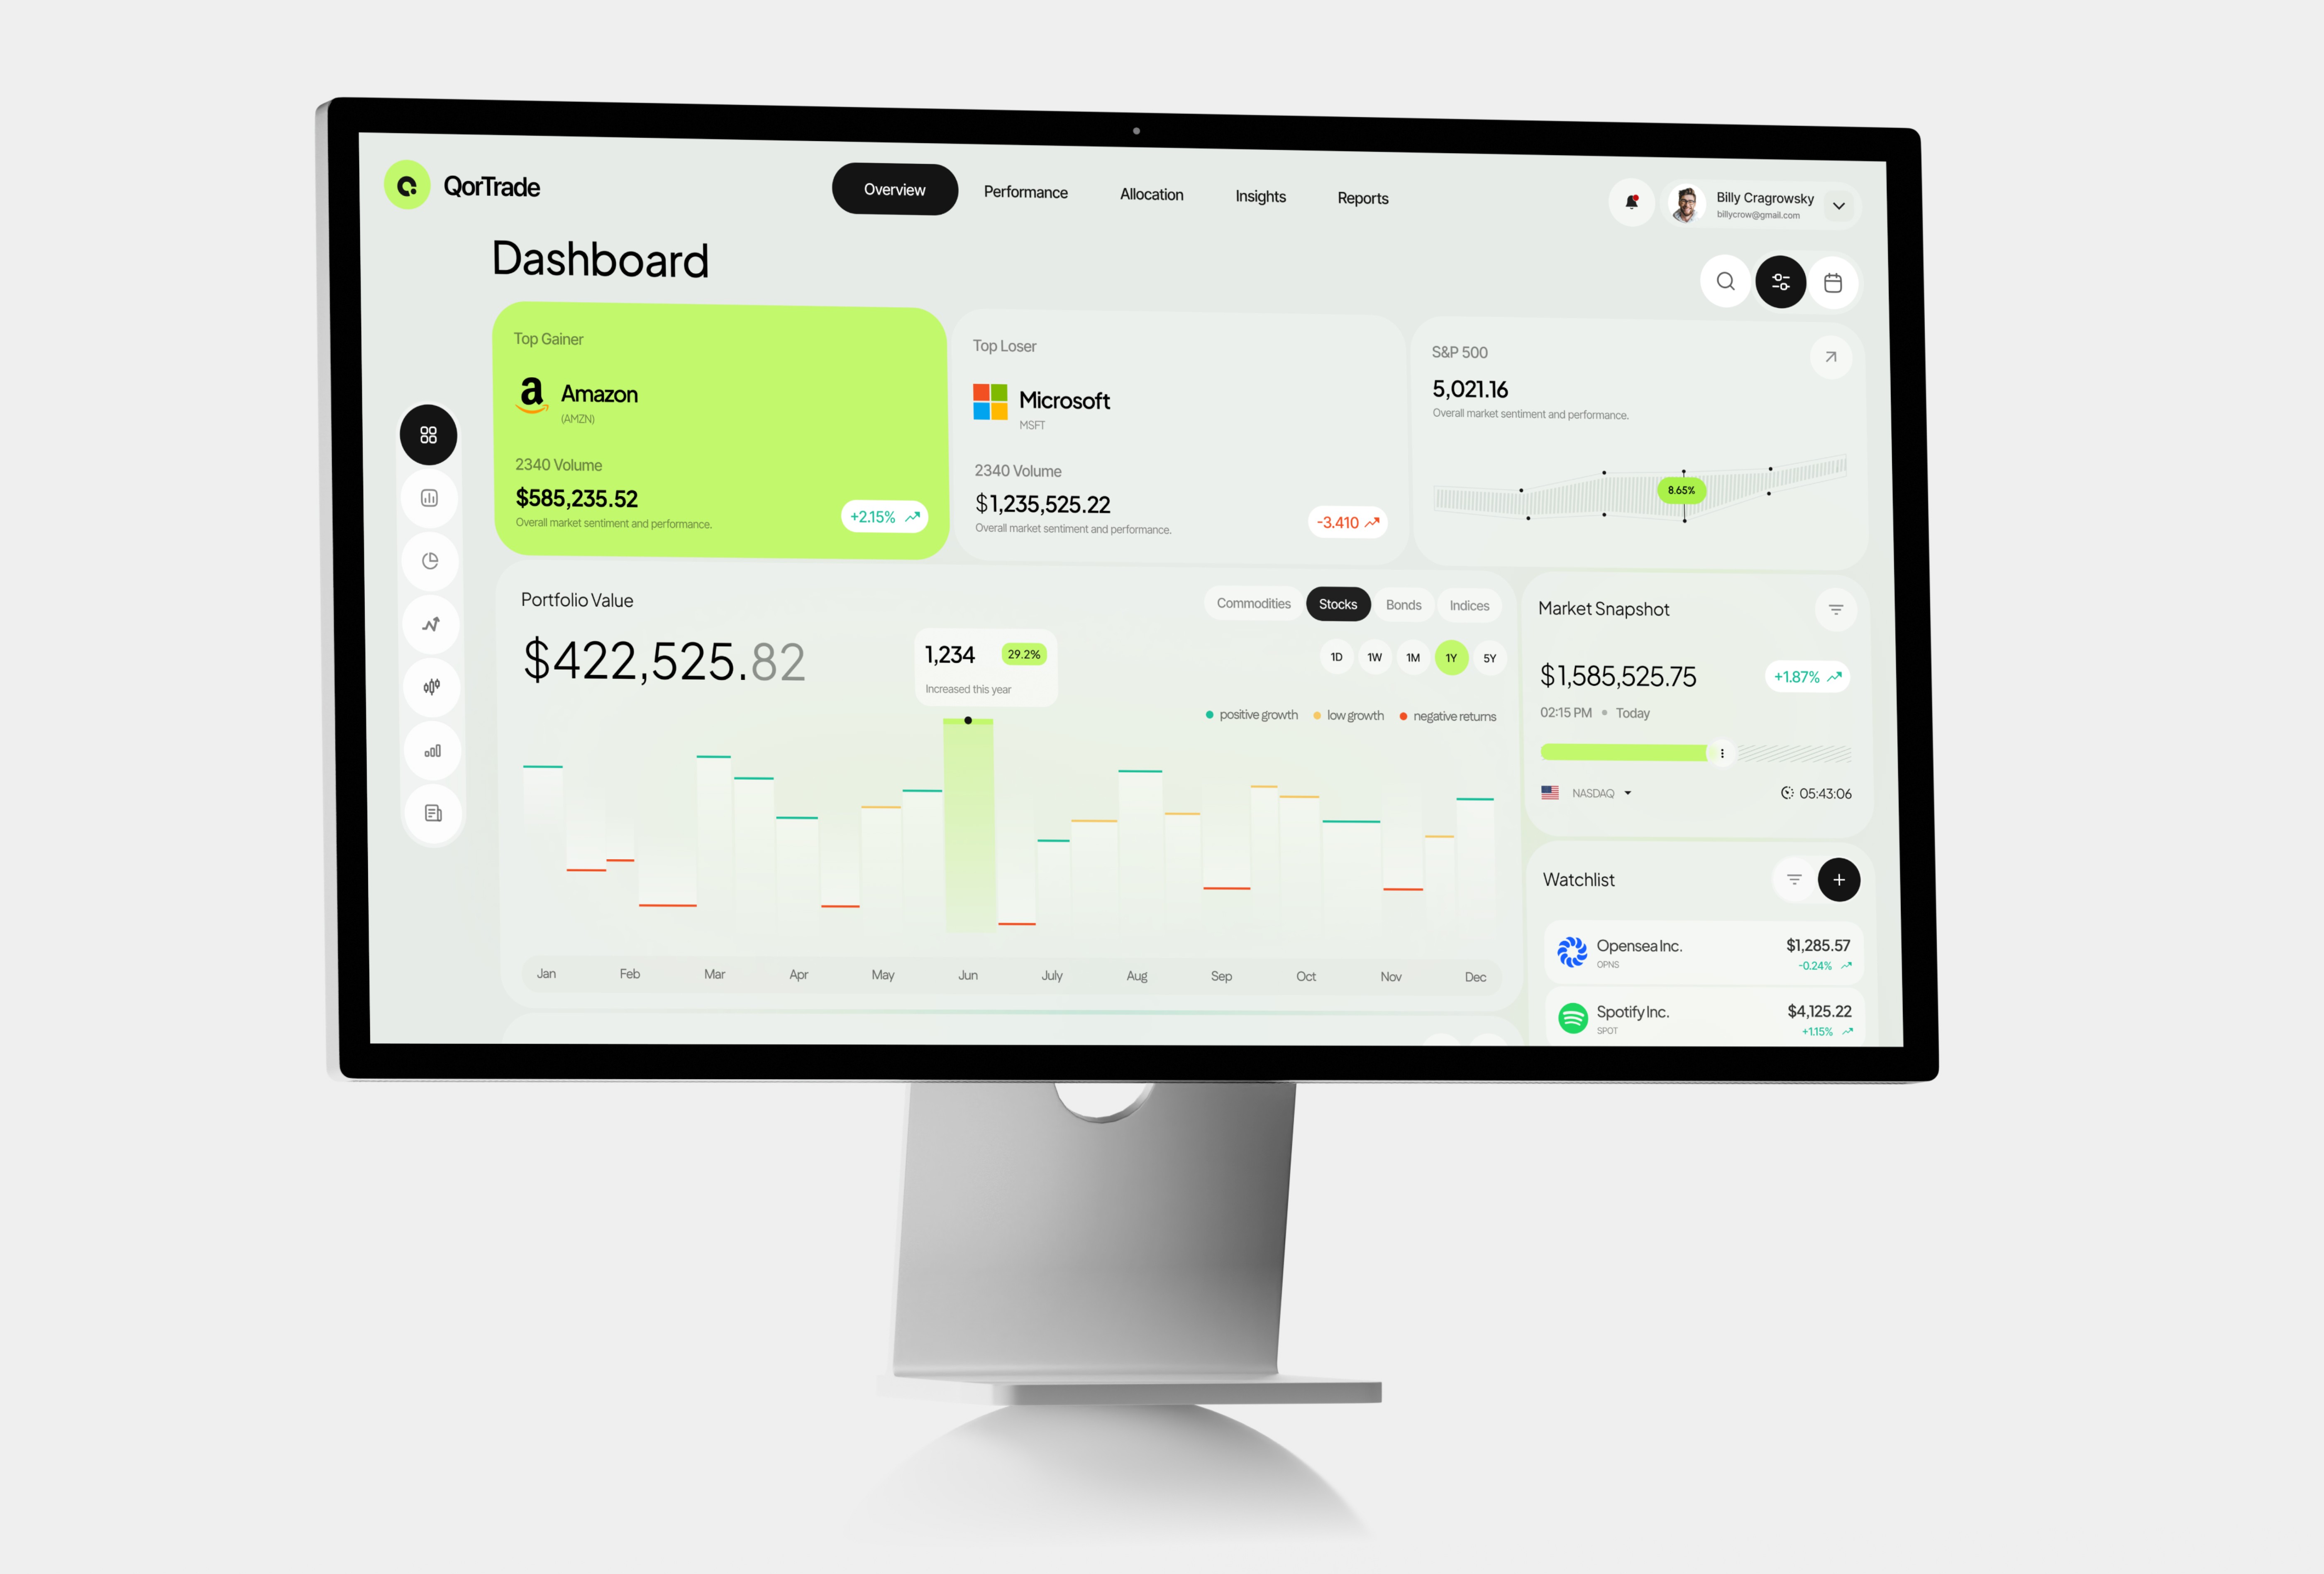
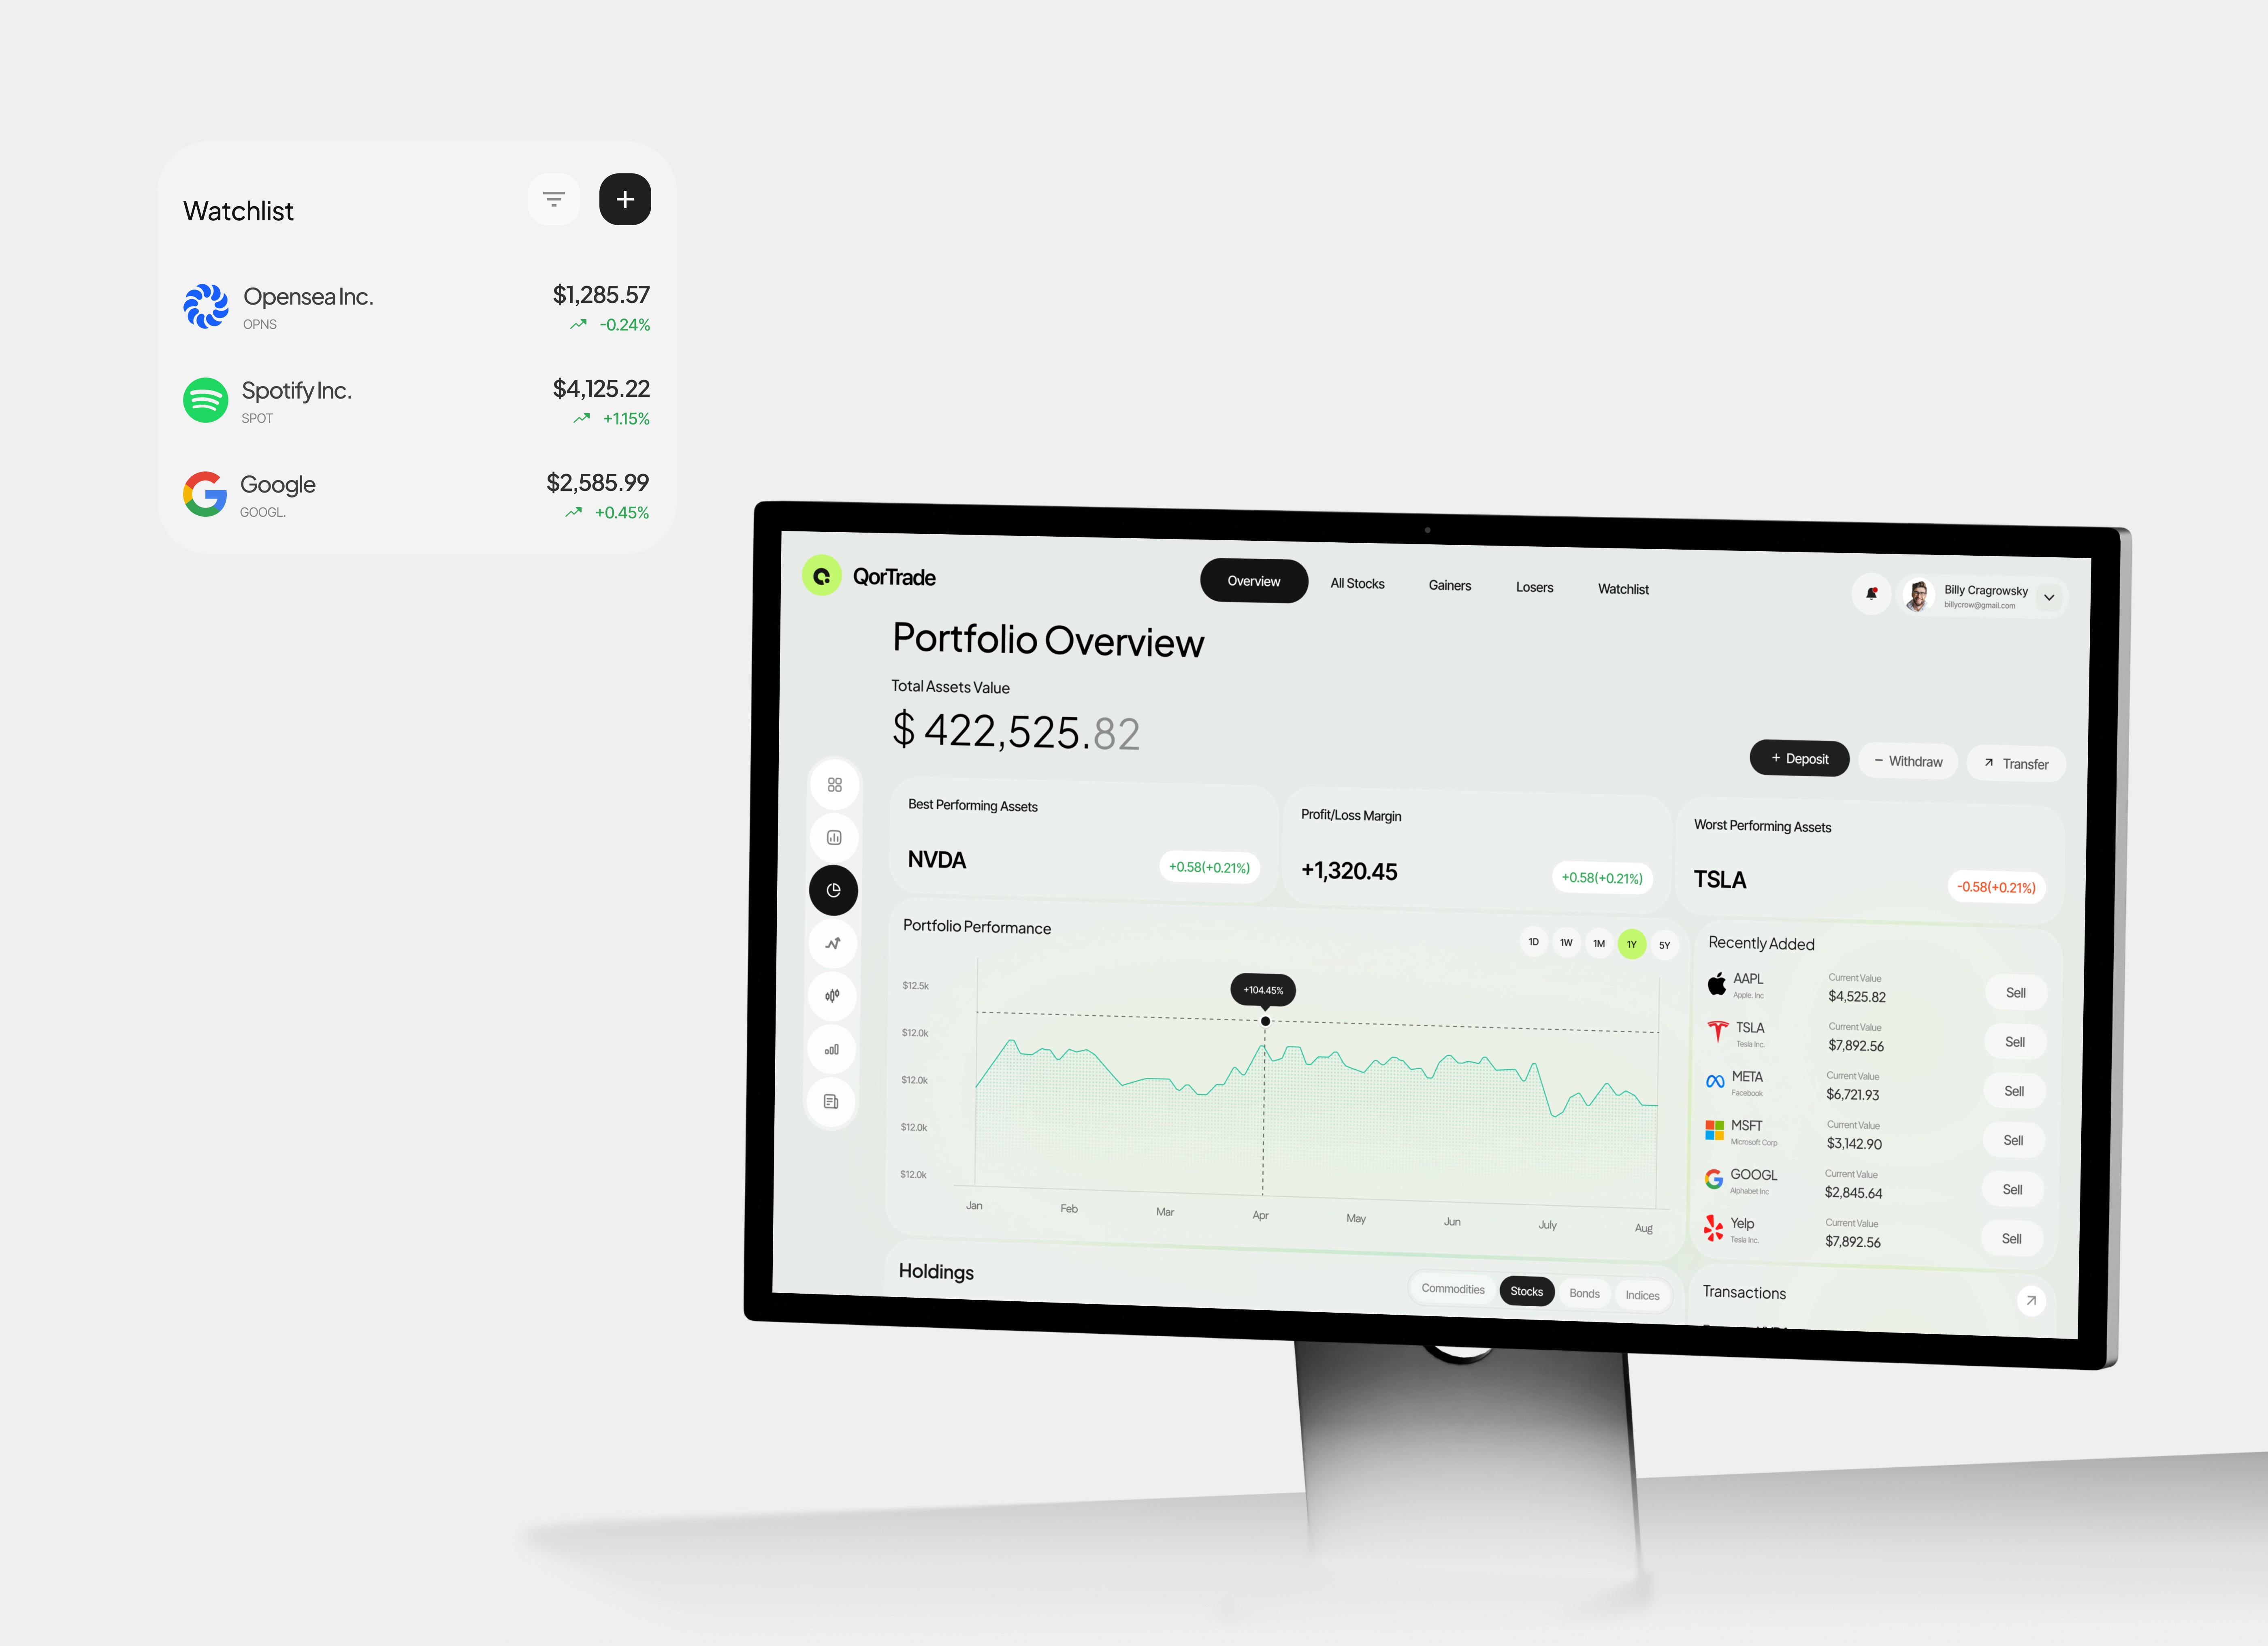
Top gainer. Top loser. S&P pulse. Portfolio value. Market snapshot — all in one unscrolled view. A dynamic overview of market pulse, key players, and vital statistics presented in an intuitive, user-friendly design.
If users have to scroll to understand where they stand, we failed. Every pixel of the dashboard is accountable.